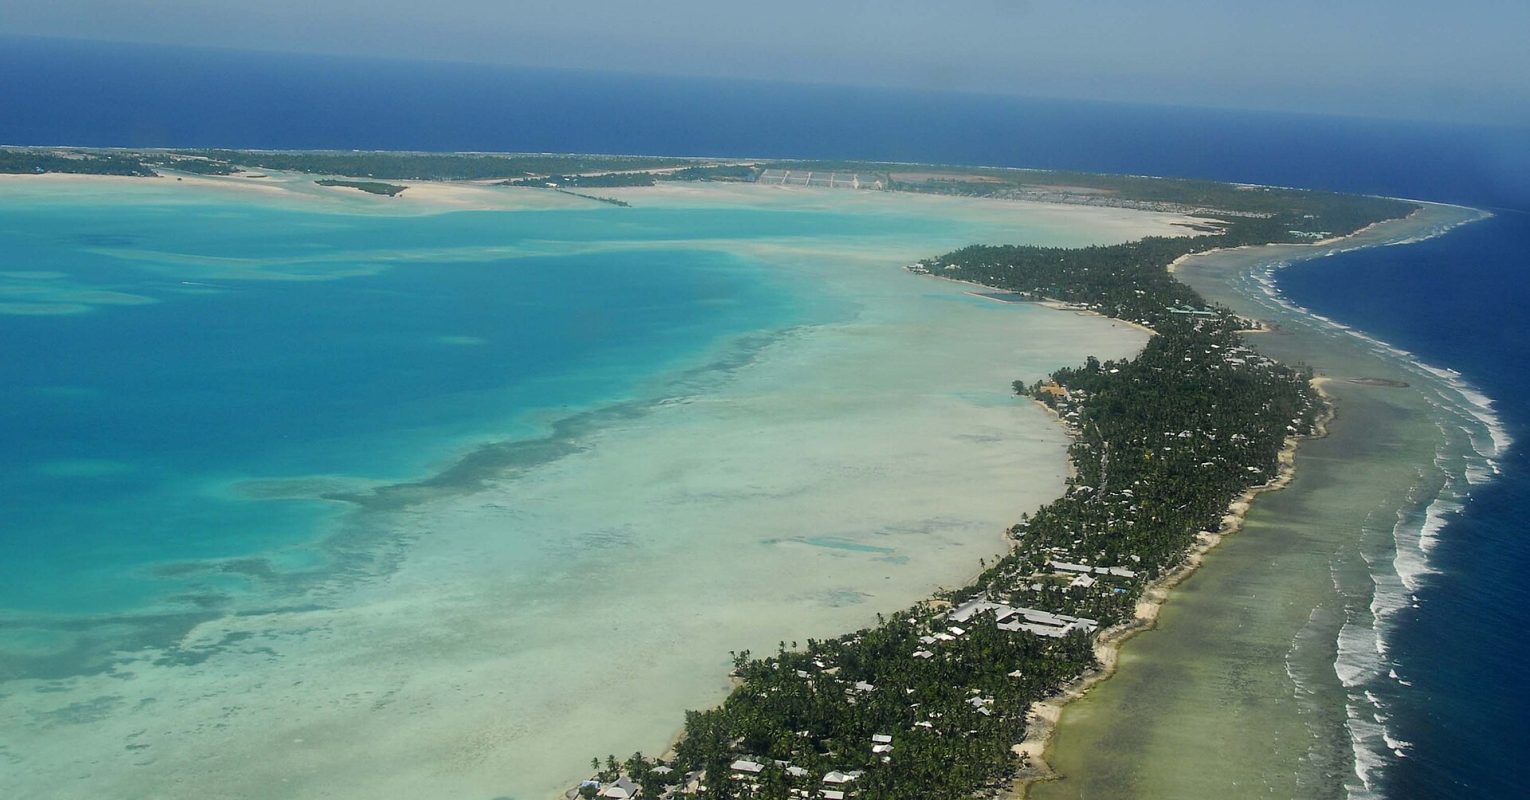
Weather overview
Южная Тарава offers a consistently warm climate year-round, with little variation in temperatures. The atolls of Южной Таравы sit near the equator, ensuring steady warmth whether you visit in January or July. Daytime highs rarely stray far from +31 °C, while nights remain mild, usually around +26 °C. The ocean mirrors this stability, with water temperatures hovering between +28 °C and +30 °C, making swimming comfortable at any time.
The year in Южной Тараве divides into distinct wet and dry periods rather than traditional seasons. March and April bring the heaviest rainfall, often in short, intense bursts. From August to November, the weather turns drier, with fewer showers and more sunshine. Travelers should note that even during the wetter months, rain rarely disrupts plans for long, as downpours are usually followed by clear skies.
Temperature
Temperatures in Южной Тараве remain remarkably stable, with only slight fluctuations between months. The warmest period falls between May and October, when daytime highs reach +31...+32 °C, while the coolest nights dip to +26 °C. Even in January or December, the difference is minimal, with averages around +28.5 °C. This consistency makes Южную Тараву an appealing destination for those seeking reliable warmth without extreme heat.
Nighttime temperatures in Южной Тараве offer little respite from the daytime warmth, staying close to +26 °C throughout the year. The narrow range between day and night means travelers won’t need to adjust for significant temperature swings. Whether exploring the atolls in February or relaxing in September, the air remains comfortably warm, though humidity can make the heat feel more pronounced during the wetter months.
| Month | Minimum | Maximum |
|---|---|---|
| January | 25.8 | 31 |
| February | 26 | 30.7 |
| March | 25.7 | 30.9 |
| April | 26.1 | 31 |
| May | 26.2 | 31.3 |
| June | 26.1 | 31.2 |
| July | 25.9 | 31 |
| August | 26.5 | 31.7 |
| September | 26.3 | 31.7 |
| October | 26.1 | 31.5 |
| November | 26.2 | 31.1 |
| December | 25.9 | 31.1 |
Precipitation
Rainfall in Южной Тараве follows a clear pattern, with the wettest months arriving in March and April. During this time, Южная Тарава receives over 300 mm of rain, often in brief but heavy showers. By contrast, August and October are the driest months, with precipitation dropping below 100 mm. Even in the wetter periods, rain rarely lasts all day, leaving plenty of time to enjoy the outdoors.
The transition between wet and dry seasons in Южной Тараве is gradual. After the heavy rains of March and April, rainfall decreases steadily, reaching its lowest point in August and September. By November, showers begin to increase again, though they remain lighter than in the early months of the year. Travelers visiting during the drier months can expect more sunshine, with up to 9 hours of daylight in September.
| Month | Precipitation |
|---|---|
| January | 189.1 |
| February | 134.2 |
| March | 350 |
| April | 234.3 |
| May | 131.3 |
| June | 175.2 |
| July | 168.1 |
| August | 80.5 |
| September | 131.4 |
| October | 88.9 |
| November | 91.4 |
| December | 180.5 |
What to pack
When visiting Южную Тараву, lightweight and breathable clothing is essential year-round. Opt for loose-fitting fabrics to stay comfortable in the consistent +28...+31 °C temperatures. A light rain jacket or umbrella is useful, especially if traveling between March and April, when sudden showers are more frequent. Don’t forget swimwear, as the ocean remains warm and inviting throughout the year.
Sun protection is crucial in Южной Тараве, where the equatorial sun can be intense even on cloudy days. Pack a wide-brimmed hat, sunglasses, and high-SPF sunscreen to shield yourself during outdoor activities. Waterproof footwear or sandals with good grip are helpful for navigating wet paths after rain. If visiting during the drier months, like August or September, a light cover-up for evenings will keep you comfortable as temperatures dip slightly.
| Month | Wind speed |
|---|---|
| January | 4.2 |
| February | 4.4 |
| March | 4.1 |
| April | 3.5 |
| May | 3.5 |
| June | 3.1 |
| July | 3.6 |
| August | 3.5 |
| September | 4 |
| October | 3.6 |
| November | 3.5 |
| December | 4.1 |