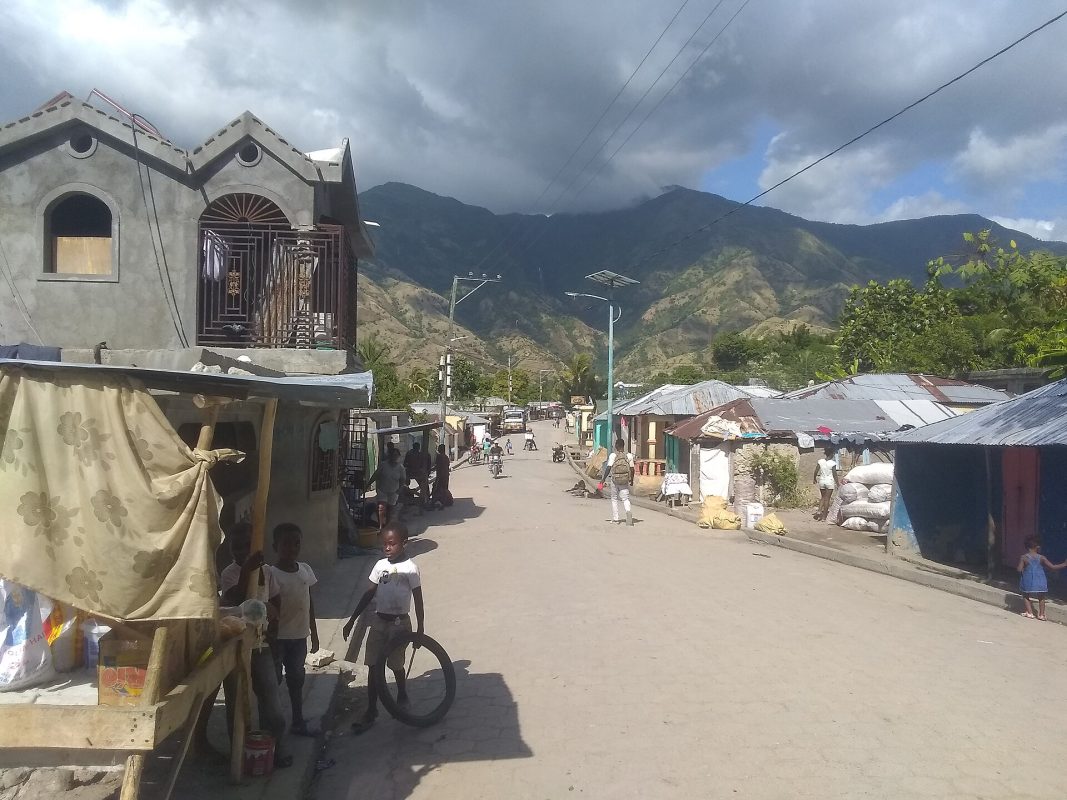
Weather overview
Tiburon sits on Haiti’s southern coast, where warm tropical weather shapes the year. The climate here is gentle, with temperatures rarely straying far from 25–29 °C, making it a place where light clothing works most of the time. The rhythm of the seasons in Tiburon is defined more by rain than by cold, with clear dry spells and predictable wetter periods.
From January to March, Tiburon enjoys its driest stretch, with minimal rain and steady warmth. The air feels fresh, and the sea stays inviting, around 27–28 °C. By April, the first signs of the rainy season appear, though downpours remain brief. The real shift comes in May, when heavier rains arrive, lasting through November with peaks in August and October. Even then, mornings often start bright, with rain usually arriving later in the day.
Temperature
Temperatures in Tiburon stay comfortably warm year-round, with little variation between day and night. In January, the coolest month, averages hover around 25.1 °C, while daytime highs reach 30.6 °C. By July and August, the heat climbs slightly, with afternoons often hitting 33–34 °C, though nights remain mild at 24–25 °C.
The sea in Tiburon is always warm, ranging from 27.5 °C in February to 30.5 °C in September and October. Even in the cooler months, the water stays pleasant for swimming, rarely dropping below 28 °C. The consistency of the warmth makes Tiburon a reliable spot for beachgoers, though the midday sun can feel intense, especially from June to September.
| Month | Minimum | Maximum |
|---|---|---|
| January | 20.2 | 30.6 |
| February | 20.7 | 31 |
| March | 21.2 | 31.1 |
| April | 22.5 | 31.4 |
| May | 23.6 | 31.8 |
| June | 24.4 | 32.7 |
| July | 24.8 | 33.9 |
| August | 25.1 | 34 |
| September | 24.6 | 33.4 |
| October | 23.9 | 32.3 |
| November | 22.8 | 31.7 |
| December | 21.3 | 31.1 |
Precipitation
Rain in Tiburon follows a clear pattern, with two distinct seasons. The dry period runs from December to March, when rainfall is light—just 23–25 mm per month. April marks the start of the transition, with rain increasing gradually, but it’s from May onward that downpours become more frequent. August and October are the wettest months, with over 150 mm of rain each, often falling in short, heavy bursts.
Despite the rain, Tiburon rarely feels gloomy. Showers tend to be brief, leaving plenty of sunshine in between. The wettest months still offer dry mornings, so outdoor plans can often go ahead with minor adjustments. If you prefer drier conditions, January and February are the safest bets, while those who don’t mind occasional rain can visit year-round without major disruptions.
| Month | Precipitation |
|---|---|
| January | 23.3 |
| February | 25 |
| March | — |
| April | 77.2 |
| May | 138.3 |
| June | 90.5 |
| July | 69.3 |
| August | 153.1 |
| September | 127.8 |
| October | 161.3 |
| November | 169.6 |
| December | 39.5 |
What to pack
For a trip to Tiburon, pack light, breathable clothing—think cotton shirts, shorts, and dresses that dry quickly. Even in the cooler months, like January or December, temperatures stay warm, so a light jacket or shawl is enough for evenings. From May to November, a compact umbrella or a waterproof layer will come in handy for sudden showers, though you won’t need heavy rain gear.
Footwear should be comfortable for walking, with sandals or breathable sneakers ideal for daytime. If you plan to spend time in the sea, reef-safe sunscreen is a must, as the sun in Tiburon can be strong year-round. A wide-brimmed hat and sunglasses will help shield you from the midday heat, especially in July and August, when the sun feels most intense.
| Month | Wind speed |
|---|---|
| January | 4.2 |
| February | 4.8 |
| March | — |
| April | 4.4 |
| May | 3.8 |
| June | 3.8 |
| July | 4.4 |
| August | 4.5 |
| September | 3.9 |
| October | 3.8 |
| November | 3.9 |
| December | 4.3 |
