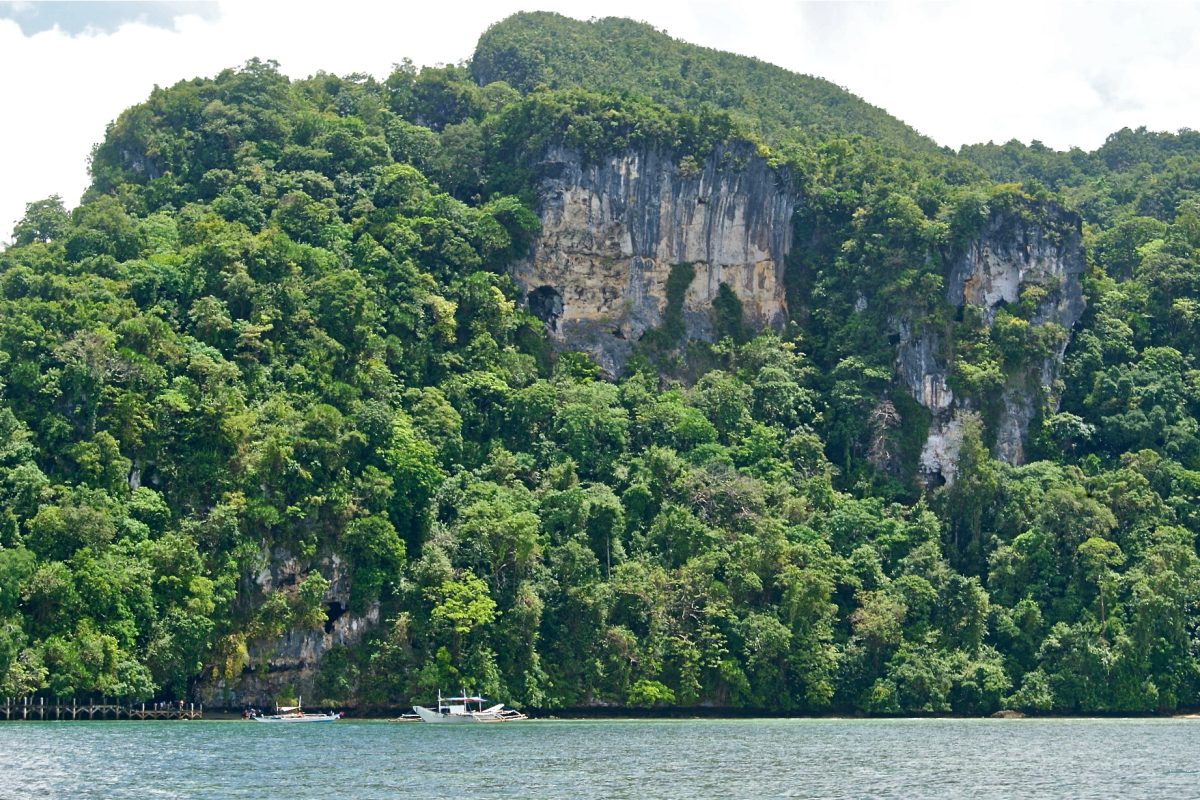
Weather overview
Quezon’s weather stays warm throughout the year, with only subtle shifts in temperature and rainfall. The city’s tropical climate means you can expect 25–32 °C most days, but the amount of rain varies noticeably by season. If you prefer drier conditions, March and April are the most comfortable months, with lower humidity and minimal precipitation.
From June to July, Quezon enters its wettest period, with frequent downpours that can last for hours. While the rain cools the air slightly, it also brings higher humidity, making the heat feel more intense. The rest of the year balances between short dry spells and moderate rainfall, so even in the so-called neutral months, an umbrella or light rain jacket is often useful.
Temperature
Temperatures in Quezon remain steady, rarely straying far from the 28 °C average. The warmest months are April and May, when daytime highs can reach 32–33 °C, while nights stay mild at around 26 °C. Even during the cooler months like January and February, the difference is minimal, with lows around 25 °C and highs near 31 °C.
The sea around Quezon mirrors this consistency, with water temperatures hovering between 28 °C and 31 °C year-round. This makes swimming and beach activities comfortable no matter when you visit, though the rougher waves during the rainy season might limit some water sports. The lack of extreme temperature swings means you won’t need heavy layers, but lightweight, breathable clothing is essential to stay comfortable in the heat.
| Month | Minimum | Maximum |
|---|---|---|
| January | 25 | 31 |
| February | 24.7 | 31.1 |
| March | 25.1 | 31.9 |
| April | 25.9 | 32.9 |
| May | 26.3 | 32.8 |
| June | 25.7 | 31.8 |
| July | 25.3 | 31.3 |
| August | 25.3 | 31.6 |
| September | 25.1 | 31.4 |
| October | 25.2 | 31.7 |
| November | 25.3 | 31.6 |
| December | 25.3 | 31.4 |
Precipitation
Quezon sees its driest weather in March and April, with rainfall dropping to around 50 mm per month. These months are ideal if you want to avoid heavy rain, though brief afternoon showers can still occur. By May, the rains begin to pick up, and by June, the city enters its monsoon season, with July being the wettest month at over 340 mm of rain.
From August onward, rainfall gradually decreases but remains significant, with September and October each bringing around 280 mm. Even in the drier months, Quezon’s tropical climate means rain is always a possibility, so planning outdoor activities for the morning can help you avoid the heaviest downpours. The rain usually comes in short, intense bursts rather than all-day drizzles, so it’s easy to work around.
| Month | Precipitation |
|---|---|
| January | 223.7 |
| February | 148.8 |
| March | 55.5 |
| April | 52.2 |
| May | 193.3 |
| June | 297.6 |
| July | 340.6 |
| August | 209 |
| September | 281.1 |
| October | 280.7 |
| November | 225.5 |
| December | 279.5 |
What to pack
For a trip to Quezon, pack light, breathable clothing to handle the year-round warmth. In the drier months like March and April, a wide-brimmed hat, sunglasses, and sunscreen are essential for protection against the strong sun. A light rain jacket or compact umbrella will come in handy even during these months, as brief showers can still occur.
During the rainy season from June to October, waterproof footwear and quick-drying fabrics become more important. Mosquito repellent is also a good idea, as the wetter months can bring more insects. Since temperatures rarely drop below 25 °C, you won’t need warm layers, but a light sweater might be useful for air-conditioned spaces or cooler evenings.
| Month | Wind speed |
|---|---|
| January | 4.7 |
| February | 4.5 |
| March | 3.7 |
| April | 3.2 |
| May | 2.7 |
| June | 2.6 |
| July | 2.7 |
| August | 2.7 |
| September | 2.7 |
| October | 2.8 |
| November | 3.4 |
| December | 4 |