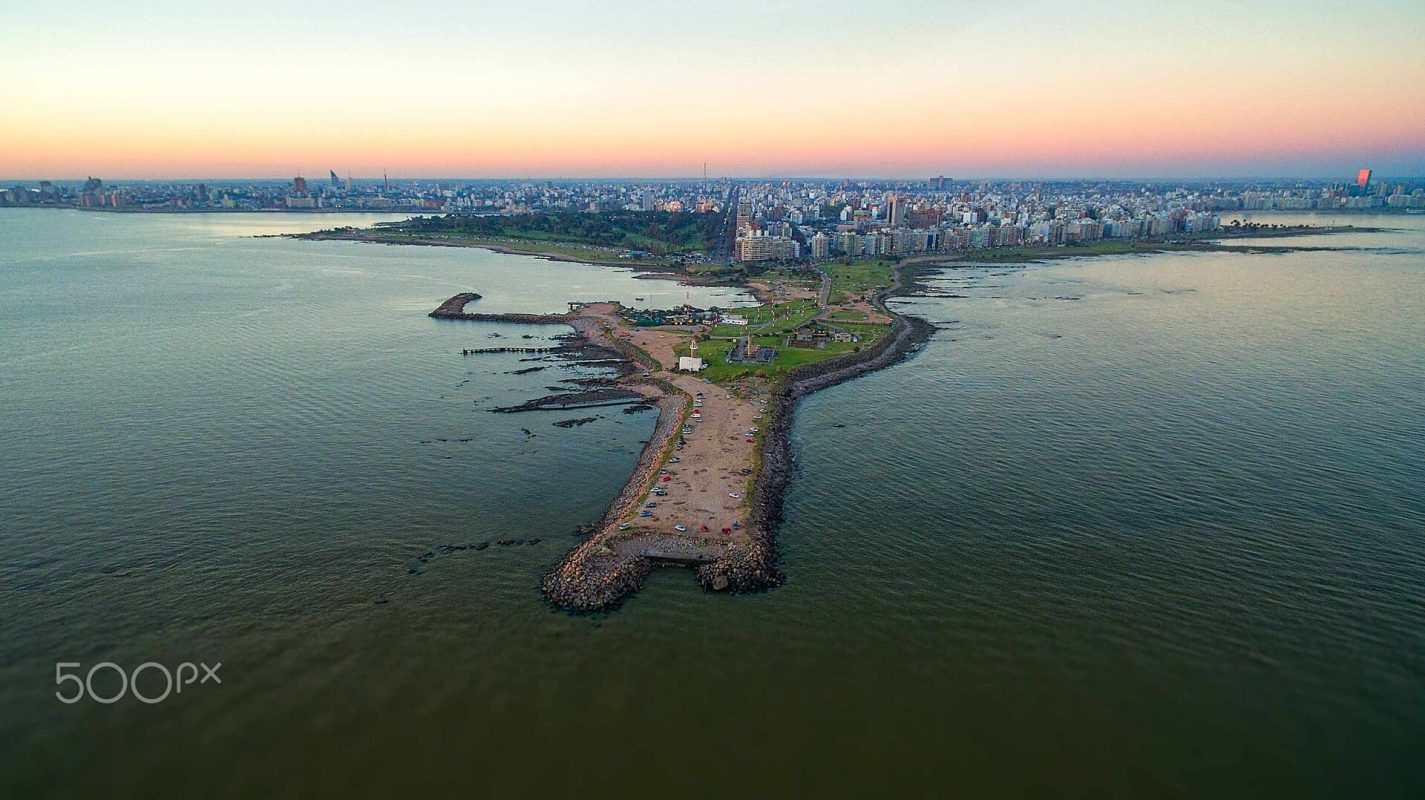
Weather overview
Punta Carretas enjoys a mild coastal climate with distinct seasons, making it a year-round destination with something for every traveler. Summers here, from December to February, are warm and lively, with daytime temperatures often reaching +26...+28 °C. This is the peak time for beachgoers, though occasional rain showers can occur. Winters, from June to August, are cooler but rarely harsh, with averages around +11...+16 °C, offering a quieter, more relaxed atmosphere.
The shoulder seasons—March to May and September to November—bring pleasant transitions. March and April still hold onto summer’s warmth, while May sees a noticeable dip to around +14 °C. By September, temperatures begin climbing again, making these months ideal for exploring Punta Carretas without the summer crowds or winter chill.
Temperature
Temperatures in Punta Carretas follow a gentle curve, with the warmest months being January and February, when highs average +28 °C and lows rarely drop below +19 °C. Evenings remain comfortable, perfect for strolling along the coast. By June and July, the coolest months, daytime highs hover around +15 °C, while nights can dip to +7 °C, so a light jacket is useful.
The shift between seasons is gradual. April and October mark the midpoints, with averages of +18 °C and +17 °C respectively. May and September are slightly cooler, around +14 °C, but still mild compared to many destinations. Water temperatures mirror this pattern, peaking at +24 °C in February and dropping to +11 °C in July, so swimming is best enjoyed from December to March.
| Month | Minimum | Maximum |
|---|---|---|
| January | 18.9 | 28.5 |
| February | 19 | 27.7 |
| March | 17.6 | 25.8 |
| April | 14 | 22.3 |
| May | 10.5 | 17.8 |
| June | 7.7 | 14.9 |
| July | 6.9 | 15.1 |
| August | 8.2 | 16.1 |
| September | 10.4 | 18.2 |
| October | 12.3 | 21.2 |
| November | 15.2 | 24.6 |
| December | 17.3 | 26.5 |
Precipitation
Rainfall in Punta Carretas is spread throughout the year, but some months are noticeably wetter. March is the rainiest, with around 124 mm, while June is the driest at just 36 mm. The summer months, January and February, see moderate rain, but showers are usually brief and don’t disrupt plans for long.
From May to September, precipitation is lighter, though July and August still bring occasional rain. The spring months, October and November, see a slight uptick, but nothing extreme. If you prefer drier conditions, June or December are good choices, though even the wetter months rarely spoil a visit to Punta Carretas.
| Month | Precipitation |
|---|---|
| January | 69 |
| February | 107.5 |
| March | 124.4 |
| April | 87.8 |
| May | 79.7 |
| June | 36.4 |
| July | 62.5 |
| August | 52.8 |
| September | 74.7 |
| October | 67 |
| November | 91.8 |
| December | 84.6 |
What to pack
For a summer trip to Punta Carretas, pack light, breathable clothing—think shorts, t-shirts, and swimwear for the beach. Evenings can be breezy, so a light sweater or shawl is handy. Don’t forget sunscreen and a hat, as the sun is strong even on cloudy days. A compact umbrella or rain jacket is useful for occasional showers in January or February.
In winter, layers are key. A warm jacket is essential for June and July, especially in the evenings when temperatures drop. Long sleeves, jeans, and closed-toe shoes will keep you comfortable during the day. If you’re visiting in April or October, a mix of light and medium layers works well, as temperatures can vary. For spring or autumn, a light waterproof layer is a good idea, just in case of rain.
| Month | Wind speed |
|---|---|
| January | 3.5 |
| February | 3.8 |
| March | 3.5 |
| April | 3.2 |
| May | 3.5 |
| June | 3.4 |
| July | 3.7 |
| August | 3.8 |
| September | 3.6 |
| October | 3 |
| November | 3.8 |
| December | 3.4 |


