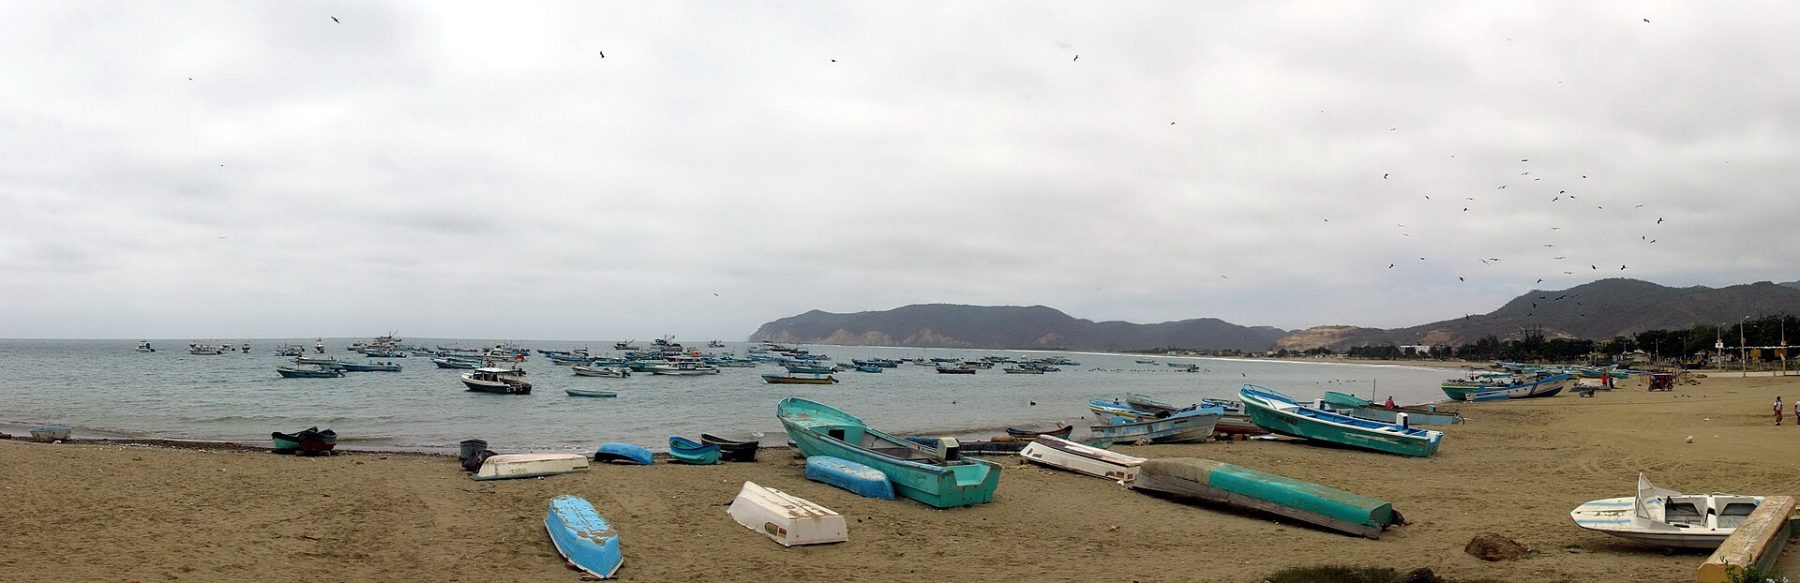
Weather overview
Puerto López enjoys a warm tropical climate year-round, with temperatures rarely straying far from the mid-20s °C. The most noticeable shifts come with the changing seasons of rain and sun. From January through April, the town experiences its wettest months, while June to November brings drier, sunnier days—ideal for exploring the coast and nearby attractions.
The transition months, like May and December, offer a mix of conditions, with May marking the end of the rainy season and December easing into slightly wetter weather. Even during the rainiest months, downpours in Puerto López are often short-lived, leaving plenty of time to enjoy the beaches and wildlife.
Temperature
Temperatures in Puerto López remain consistently warm, with daytime highs typically reaching 28–29 °C and nighttime lows around 22–24 °C. The hottest months are March and April, when the mercury can climb to 29.8 °C, while the coolest period falls between August and September, with lows dipping to 21.6 °C.
Even during the cooler months, the difference is subtle—Puerto López rarely feels chilly, thanks to its coastal location. The ocean also plays a role, with water temperatures staying between 24.6 °C and 28 °C year-round, making swimming and water activities comfortable in any season.
| Month | Minimum | Maximum |
|---|---|---|
| January | 23.5 | 29.2 |
| February | 23.6 | 29.4 |
| March | 23.7 | 29.6 |
| April | 23.6 | 29.8 |
| May | 23.4 | 29.1 |
| June | 22.4 | 28.1 |
| July | 22.1 | 28.3 |
| August | 21.8 | 28.3 |
| September | 21.6 | 28.2 |
| October | 21.7 | 28 |
| November | 21.5 | 28.2 |
| December | 22.7 | 28.5 |
Precipitation
Rainfall in Puerto López is highly seasonal, with the bulk of the year’s 786 mm falling between February and April. February and March are the wettest months, averaging over 200 mm of rain each, while July through November see almost no precipitation at all.
The dry season, from June to November, is the most popular time to visit Puerto López, as sunny skies dominate and rain is rare. Even in the wetter months, rain usually comes in brief, heavy showers rather than all-day downpours, so it’s still possible to enjoy outdoor plans with some flexibility.
| Month | Precipitation |
|---|---|
| January | 76.3 |
| February | 224.6 |
| March | 215.2 |
| April | 103.1 |
| May | 69.4 |
| June | 18.1 |
| July | 8.9 |
| August | 4.1 |
| September | 5.7 |
| October | 6.4 |
| November | 4.9 |
| December | 49.8 |
What to pack
For a trip to Puerto López during the dry season, lightweight, breathable clothing is key. Pack shorts, T-shirts, and swimwear for the beach, along with a light jacket for cooler evenings. A wide-brimmed hat and sunscreen are essential year-round, as the sun can be strong even on cloudy days.
If visiting between January and April, include a compact rain jacket or umbrella to stay dry during short downpours. Waterproof footwear can also be useful for exploring after rain. Since temperatures stay warm, there’s no need for heavy layers—just focus on staying comfortable in the tropical heat.
| Month | Wind speed |
|---|---|
| January | 3.1 |
| February | 2.4 |
| March | 2.2 |
| April | 2.6 |
| May | 3.5 |
| June | 3.7 |
| July | 3.9 |
| August | 4 |
| September | 4.3 |
| October | 4.2 |
| November | 4.4 |
| December | 3.8 |


